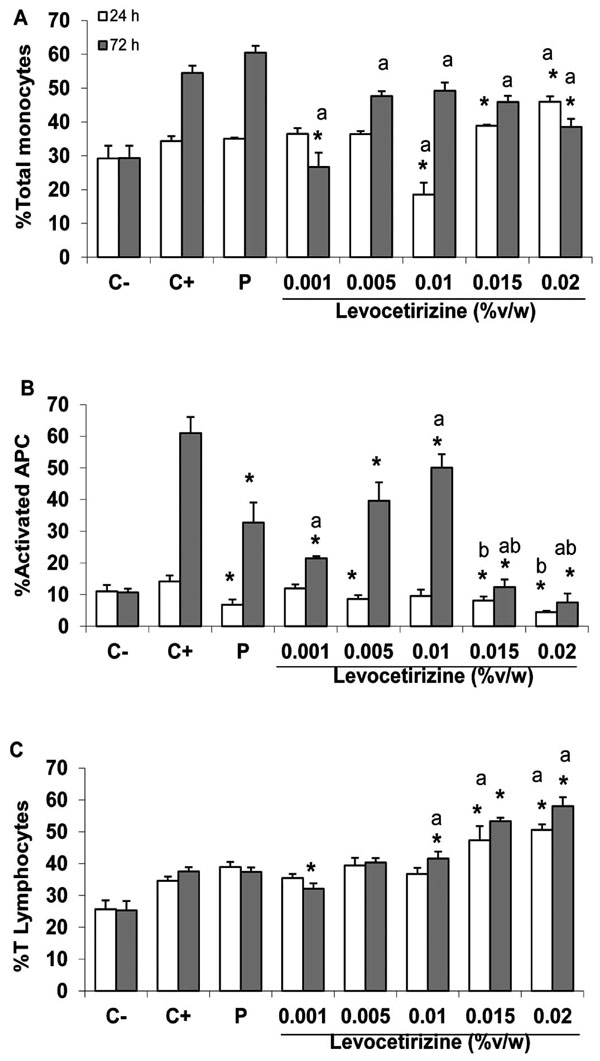
Fig. (3) Proportion of total monocytes (A), OVA-activated APCs
(B), and recruited T lymphocytes (C) in draining lymph nodes
(flow cytometry) from DO11.10TcR-Tg mice (C-) exposed to OVA
for 6 h (C+) and treated for 24 (white bars) or 72 h (grey bars) with
placebo (P) or Levocetirizine ophthalmic solution at five different
concentrations. *p<0.05 vs C+, ap<0.05 vs placebo, Student’s t-test
(n = 6), bp<0.05 ANOVA.