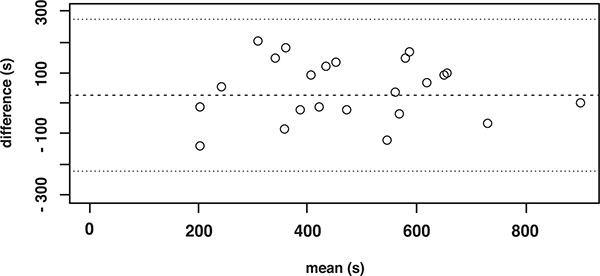
Fig. (1) The difference between the Session 2 and Session 1 total FIT-HaNSA scores (vertical axis) and the mean of the Session 1 and Session 2 total FIT-HaNSA scores (horizontal axis) for the 25 WAD2 participants. The mean difference (26 s) is the heavy dotted line and the limits of agreement (-223, 275) are the lighter dotted lines.