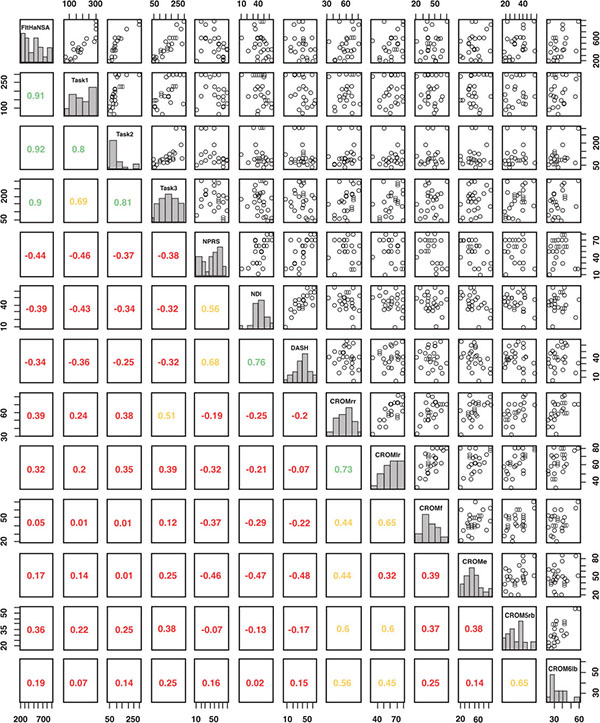
Fig. (3) Pairwise scatterplots (upper tableau) and Spearman rank correlations (lower tableau) for the total and Task 1, 2, and 3 FIT-HaNSA, NPRS, NDI, DASH, CROMrr, CROMlr, CROMf, CROMe, CROMrb, and CROMlb scores for the 25 WAD2 participants assessed at Session 1. The correlations are color coded as red = low (|ρ| < 0.4), amber = moderate ( 0.4 ≤ |ρ| ≤ 0.7) and green = high (|ρ| > 0.7). Each outcome’s distribution is also plotted as a histogram along the diagonal. Abbreviations defined in Table 2.