Fig. (1)
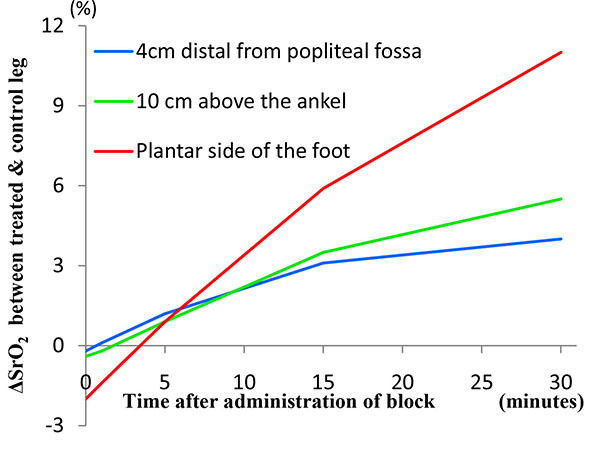
Evolution of difference in SrO
2
between operated and control leg (= ΔSrO
2
). Comparison of three groups with different location of SrO
2
measurement electrodes. The error bars represent one standard deviation of uncertainty.