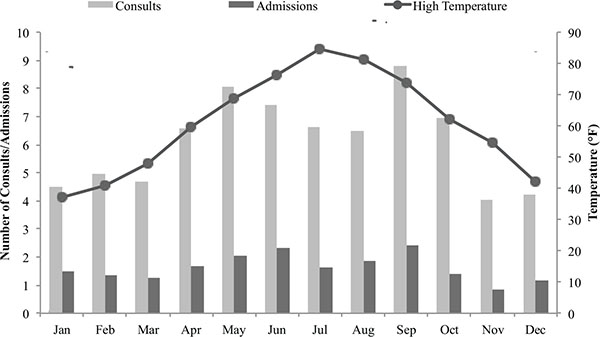
Fig. (2)
Average daily consults and admissions with average high temperature by month.