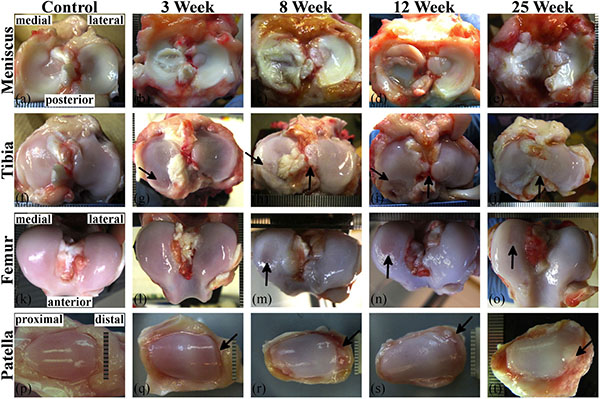
Fig. (1) Images from the ACLT stifles showing the gross anatomical progression trend of early stage OA of the (a-e) meniscus, (f-j) tibia, (k-o) femur, and (p-t) patella. The OA progression model includes control, 3-, 8-, 12-, and 25-week post-ACL transection samples. The progression seen here is a general description and does not show the variation typically seen in each time-point group. On the medial tibia condyle (g-i) the arrow indicates a posterior lesion increasing in severity through 12-weeks. The vertical arrows in (g) and (j) indicate edge welling and intercondylar area tissue growth, respectively. The arrows in (m-o) point to surface abrasions on the medial femoral condyles. The arrows in (q-t) indicate increasing distal edge damage and pathological growth on the patella. Scale increments are 1 mm.