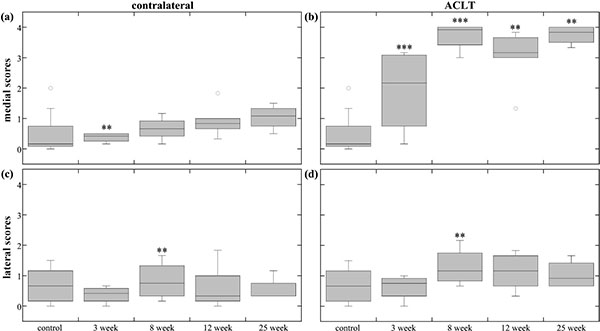
Fig. (3) Meniscus scores. The box plots show the average score range (error bars) and average median score (horizontal line) of the different time-points for (a) medial contralateral meniscus, (b) medial ACLT meniscus, (c) lateral contralateral meniscus, and (d) lateral ACLT meniscus. The outlier points are not included in the statistics box, but show how extreme variation can occur within a time-point group. The ** and *** indicate statistical significance (p<0.05) and high statistical significance (p<0.001) in blinded score change, respectively. Blinded score change was either an increase or decrease from the previous time-point, and was determined by the mixed-model comparisons.