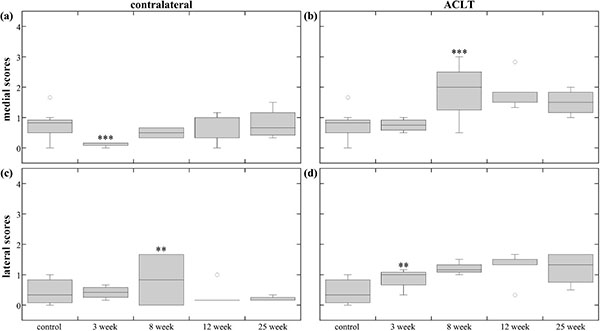
Fig. (4) Tibia scores. The box plots show the average score range (error bars) and average median score (horizontal line) of the different time-points for the (a) medial contralateral tibial condyle, (b) medial ACLT tibial condyle, (c) lateral contralateral tibial condyle, and (d) lateral ACLT tibial condyle. Only two 8-week contralateral tibiae are included in statistics box. The ** and *** indicate statistical significance (p<0.05) and high statistical significance (p<0.001) in blinded score change, respectively. Blinded score change was either an increase or decrease from the previous time-point, and was determined by the mixed-model comparisons.