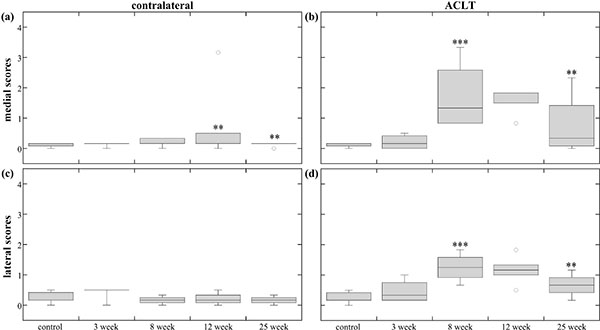
Fig. (5) Femur scores. The box plots show the average score range (error bars) and average median score (horizontal line) of the different time-points for the (a) medial contralateral femoral condyle, (b) medial ACLT femoral condyle, (c) lateral contralateral femoral condyle, and (d) lateral ACLT femoral condyle. Only one 3-week and three 8-week contralateral femurs were included in statistics box. The damage and repair trend is easily seen in (b) and (d) as a peak in score at 8-weeks and a following decrease. The ** and *** indicate statistical significance (p<0.05) and high statistical significance (p<0.001) in blinded score change, respectively. Blinded score change was either an increase or decrease from the previous time-point, and was determined by the mixed-model comparisons.