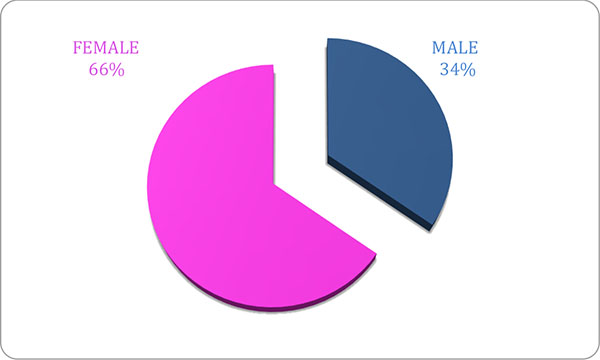
Fig. (2)
Pie chart representing the the breakdown of females and males undergoing CTPA’s during the study period. The majority of patients were females (n=47, 66%) compared to males (n=24, 34%).