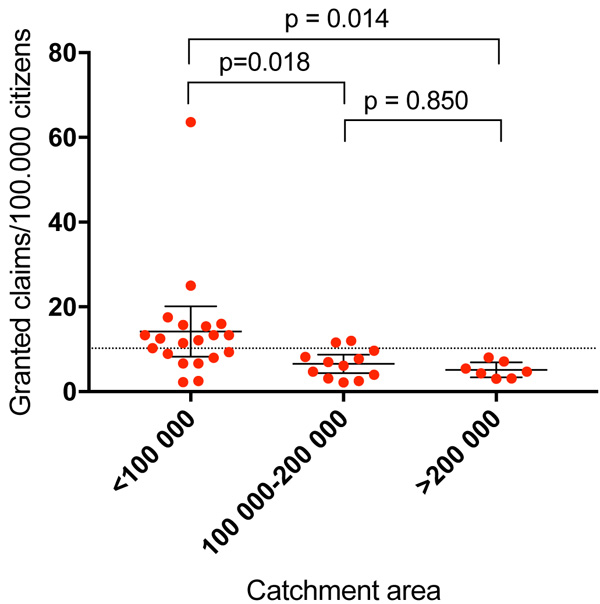
Fig. (2)
Number of granted complaints in respect to patient volume. The three categories on the x-axis represent the catchment population of the hospitals.