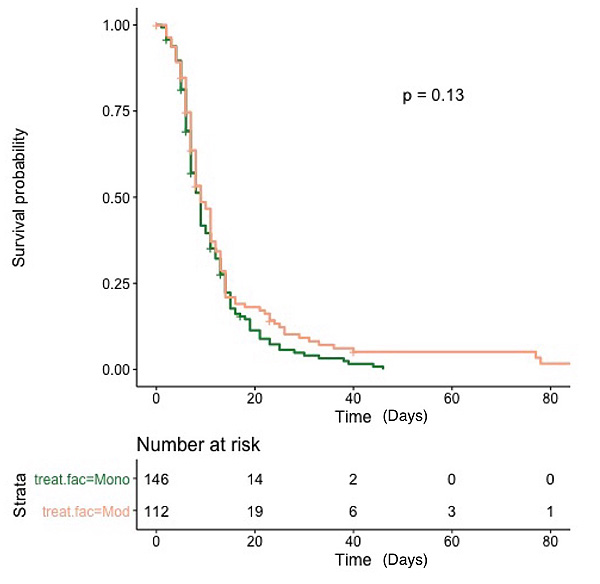
Fig. (2)
Kaplan-Meier plot of length of hospital stay for each treatment group, along with risk table.