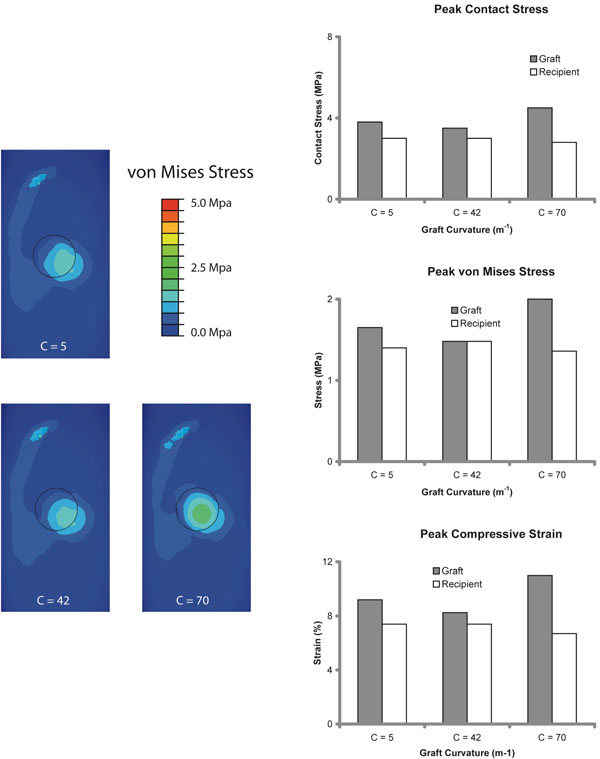
Fig. (5) Results of Variation in Graft Curvature. Left column: Contour maps of von Mises stress distribution show the location of peak stresses for grafts of different curvature (C = graft curvature). Right column: Increasing the graft curvature increased stresses and strains.