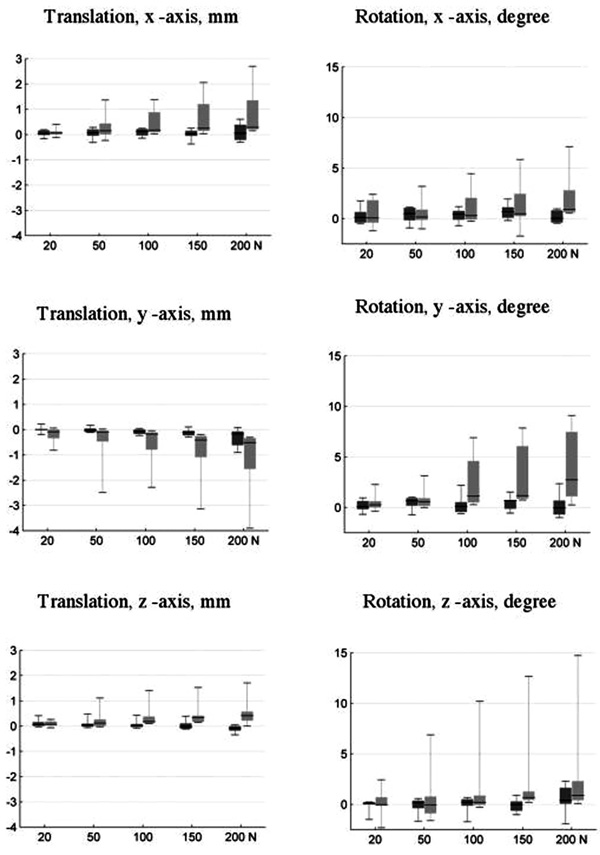
Fig. (3)
Relative fracture fragment motion measured for the PLATE and CSO. Shown is a boxplot diagram for relative movements of the osteotomy fragments in millimeter rsp. degree (mean indicated by small black line).