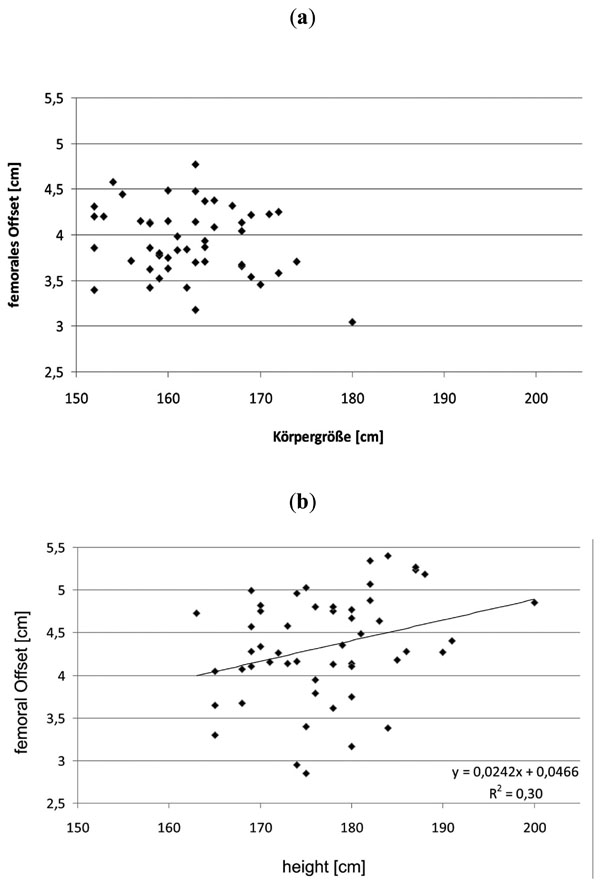
Fig. (2) The scatterplot for the correlation between FO and height
for both females (a) and males (b) is shown. Note: a significant
correlation between FO and height could be observed in males,
whereas such a correlation could not be found in females. A linear
line of fit is given in the diagram for males (FO femoral offset).
(r=0.09, n = 51, p<0.03).