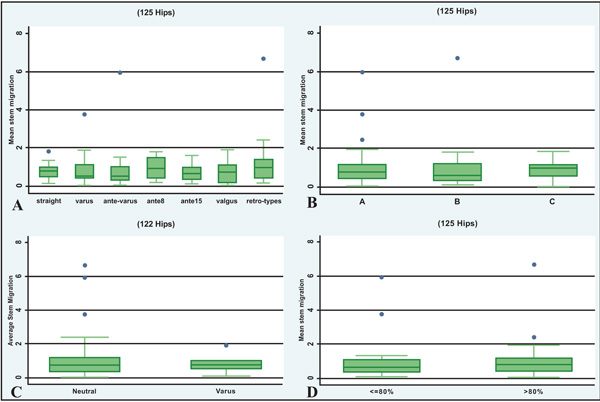
Fig. (4)
Boxplots showing the relationship between migration and the categorical variables of interest, i.e. neck type (
A
), bone quality (Dorr’s A, B, C bone quality) (
B
), stem positioning (neutral
vs
varus) (
C
) and midstem fill (<80%
vs
>80%) (
D
).