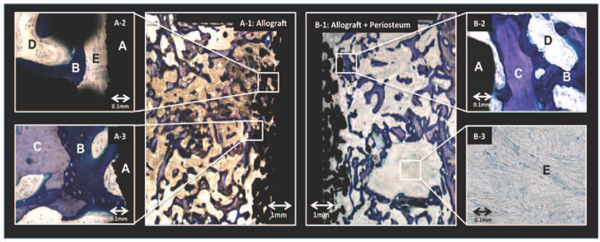
Fig. (4) Histology: Representative histologic sections of the control group (A: Allograft) and the intervention group (B: Allograft +
periosteum). The sections are from two implants inserted in the same animal. Left side (allograft only): A-1: Overview of implant and bone
graft; A-2: Thin fibrous tissue membrane in contact with implant; A-3: Allograft bone chip with ongrowth of new bone in contact with
implant. Right side (Allograft + periosteum): B-1: Overview of implant and bone graft. Large island of fibrous tissue is seen in the gap with
activity of new bone formation in its vicinity. B-2: Allograft bone chip with ongrowth of new bone in contact with implant; B-3:
Magnification of the island revealing solid fibrous tissue. A = Implant, B = New bone, C = Allograft bone, D = Marrow space, E = Fibrous
tissue. (Stain, toluidine blue; magnification, x28 (A-1 and B-1), x230 (A-2, A-3, B-2 and B-3).