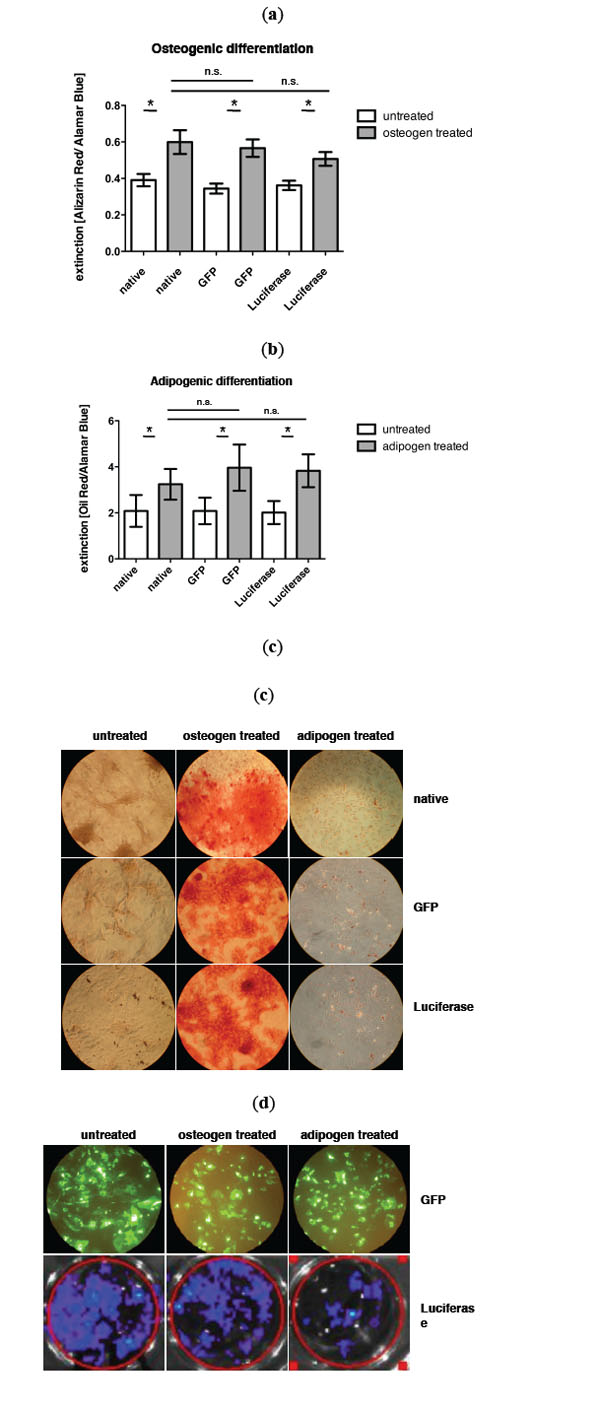
Fig. (1) a) Quantification of osteogenic differentiation via alizarin red staining and b) adipogenic differentiation via oil red staining of nontransduced
control MSCs, GFP transduced MSCs and luciferase transduced MSCs. c) Representative pictures of osteogenic and adipogenic
differentiation after respective staining. d) Expression of GFP and luciferase in MSCs during differenatiation assay (day 14), upper row: BLI
of luciferase expressing MSCs.