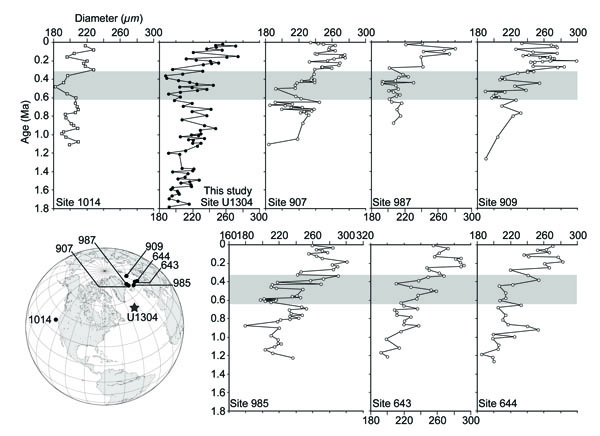
Fig. (3) Correlation of mean shell size between the North Pacific (open square) [4], North Atlantic (solid circle; this study), and the Norwegian
– Greenland Sea (open circle) [3]. Map showing locations of ODP and IODP sites presented in this figure. Shaded area shows the duration
which shell size decrease.