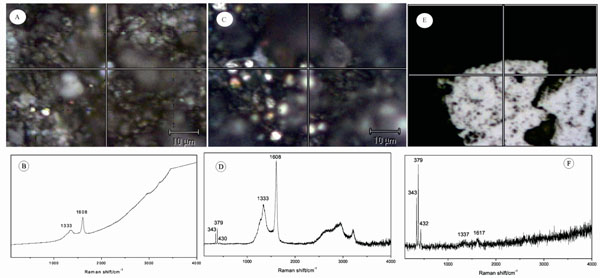
Fig. (5) Raman microspectroscopy. The point of crosswire in photos A, C, and E indicates the location of Raman detection.A, B Isolated spheroidal specimen with Raman spectrum showing the 1333 and 1608 cm-1 bands of carbonaceous (organic) matter. C, D
Soccer ball-like spheroid specimen with Raman spectrum showing the 343, 379 and 432 cm-1 bands of pyrite and 1333 and 1608 cm-1 bands,
and three wider and gentle curve peaks between the 2500 and 3250 cm-1 bands of carbonaceous (organic) matter. E, F Pyrite framboids with
Raman spectrum showing distinct 343, 379 and 432 cm-1 bands and very weak curve peaks at the 1337 and 1617 cm-1 bands of carbonaceous
material (graphite).