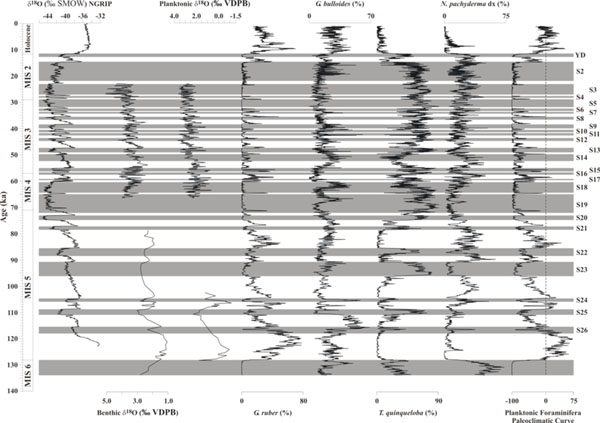
Fig. (2) Downcore variations of geochemical data and planktonic foraminifera species at ODP Site 963, plotted versus calibrated age (kyr)
and showing the marine isotopic stratigraphic framework. From the left, oxygen isotopic record of Greenland ice cores [50]; benthic and
planktonic oxygen isotopic records at ODP Site 963 [14, 16]; distribution patterns of G. ruber, G. bulloides, T. quinqueloba and N.
pachyderma dx at ODP Site 963, expressed as percentage values [13, 14, 16, 39]; downcore variations of the planktonic foraminifera
paleoclimatic curve. Light grey bands mark Stadials, white bands mark Interstadials. S26-S2 show the sequence of Stadials across the
sequence. YD: Younger Dryas.