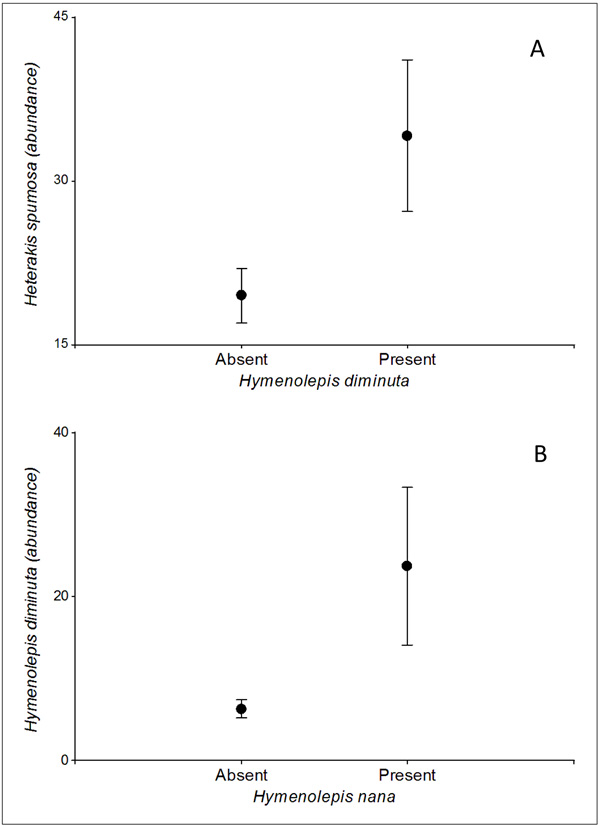
Fig. (2)
Graphs representing the mean abundance of H. spumosa of infracommunities of R. norvegicus with and without H. diminuta(A) and the mean abundance of H. diminuta of infracommunities with and without H. nana(B). Bars represents the standard errors.