, cells incubated with 30 µM HEDP
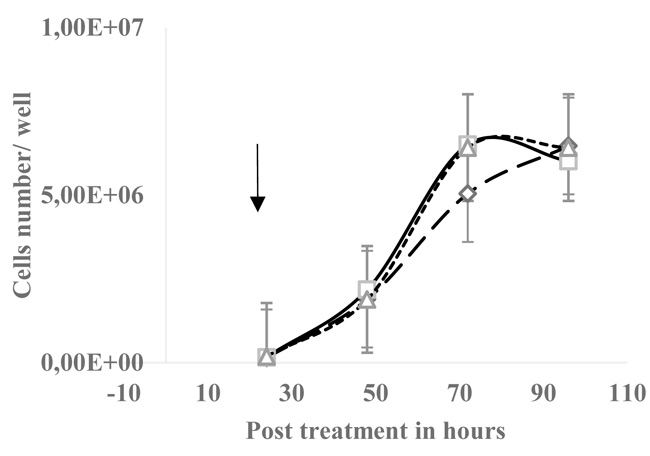
  or IB
or IB  . Every point is the mean ± SD of a triplicate sample. Only the viable cells were graphed.
, cells incubated with 30 µM HEDP or IB . Every point is the mean ± SD of a triplicate sample. Only the viable cells were graphed.
. Every point is the mean ± SD of a triplicate sample. Only the viable cells were graphed.
, cells incubated with 30 µM HEDP or IB . Every point is the mean ± SD of a triplicate sample. Only the viable cells were graphed.