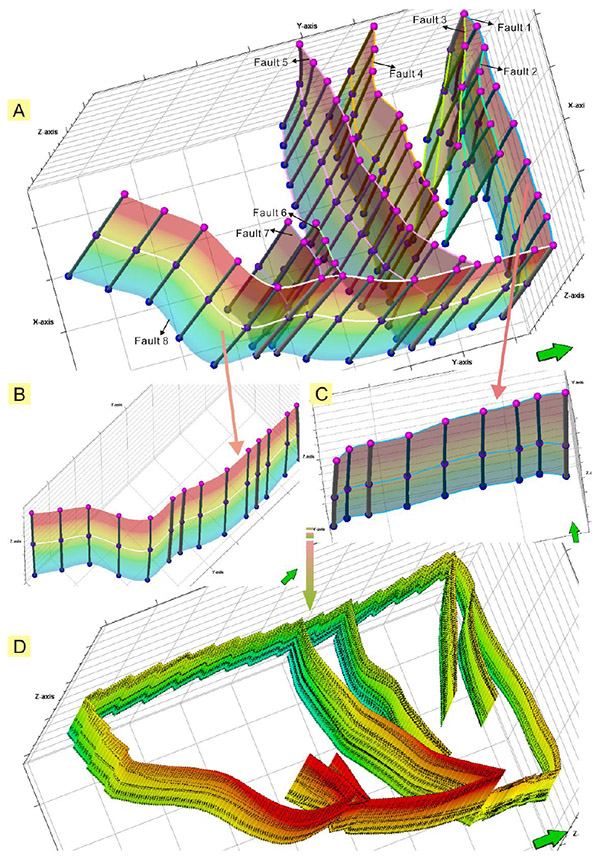
Fig. (4)
3D fault model of the study area. A: regional fault model established with Minimum Curvature method, showing the spatial distribution and the connection relationship between faults; B: boundary fault No. 8; C: boundary fault No.1; 3D fault surface and the edges of modeling area.