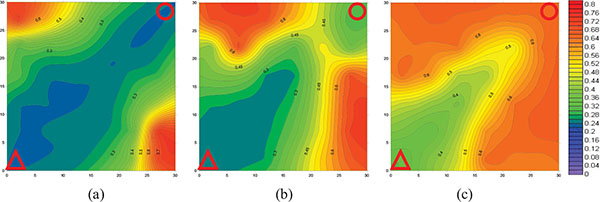
Fig. (10)
Oil saturation distribution of each layer (Scheme 2-1). (
a
) high permeability layer; (
b
) medium permeability layer; (
c
) low permeability layer. Where, ∆ represents injection well, and ○ represents production well.