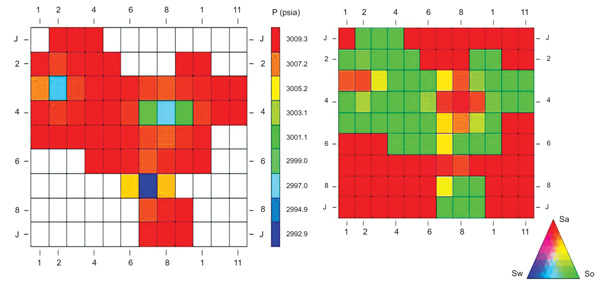
Fig. (8)
Pressure and saturation distribution map of reservoir X.