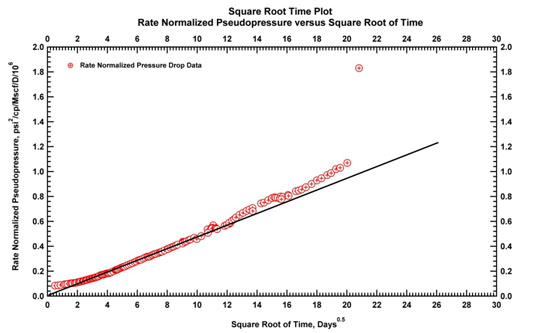
Fig. (13)
Square root time plot. Straight line is drawn on portions of data which exhibit linear flow behavior.