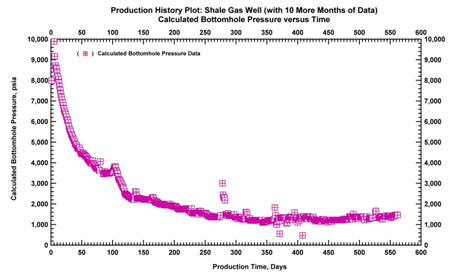
Fig. (21b)
Calculated bottomhole pressure and time plot with additional data (10 more months).