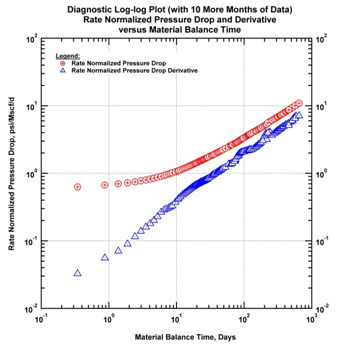
Fig. (21c)
Log-log diagnostic plot with additional data (10 more months).