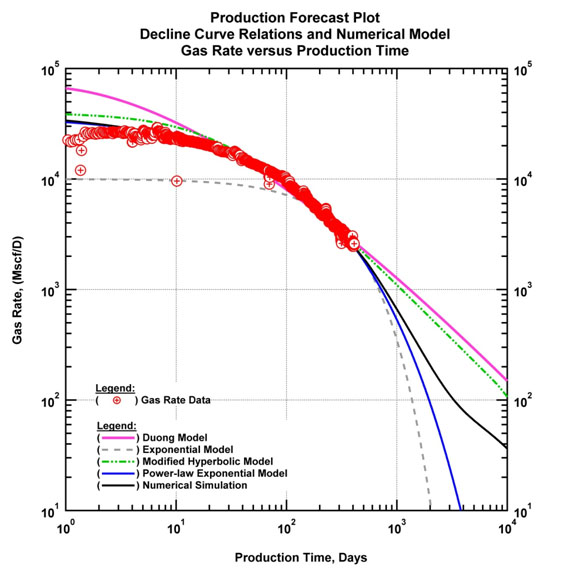
Fig. (24)
(Log-log) Rate and time plot with several DCA models.