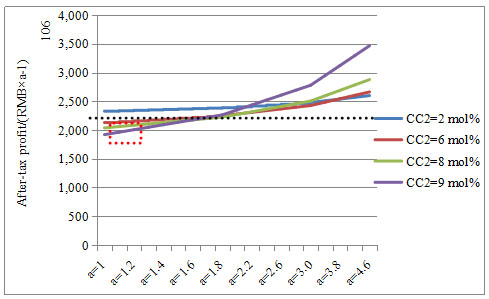
Fig. (5) Trend chart for the after-tax net profit changed with feed-in LNG’s components and the difference between LPG price and NG price for LH recovery process. The red dashed box indicates the range of typical Chinese LNG feed components and the difference between LPG price and NG price. The black dotted line represents the after-tax net profit of Plan B. CC2 indicates the mole concentration of C2 in the feed-in LNG and indicates the times of the price of LPG over that of the NG.