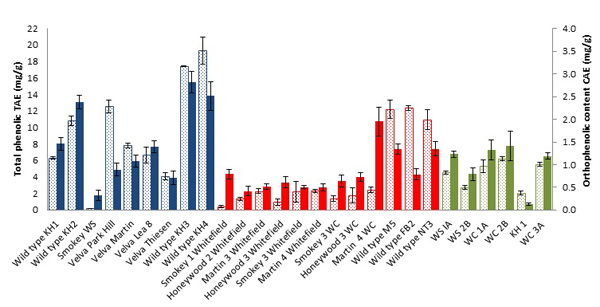
Fig. (1) Representative data showing the total phenolic content (solid) and Orthophenolic Content (pattern) in ethanol extracts of juneberries from cultivars in 2012 (blue), 2013 (red), and 2014 (green). Data shown are means ± standard deviation (n=5 experiments).