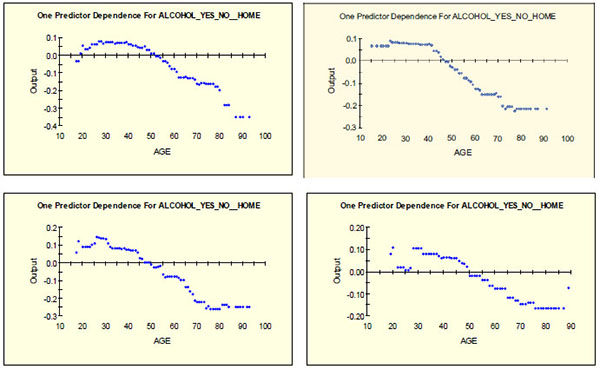
Fig. (1)
Age of head of household and log odds of alcohol consumption at home in 2006 (above left), 2007 (above right), 2009 (bottom left), and 2011 (bottom right). Partial effects.