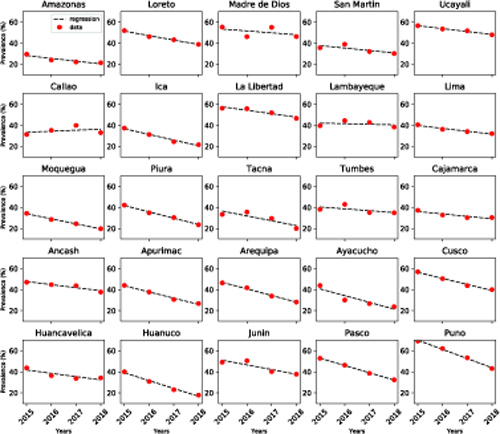
Fig. (3)
Trends of the prevalence of anemia in children aged 6 months to 5 years of age at an administrative regional level during the 2015-2018 period. The red points represent the prevalence of childhood obtained from SIEN, whereas the black-dashed lines are our estimated best-fit lines (Eq.1).