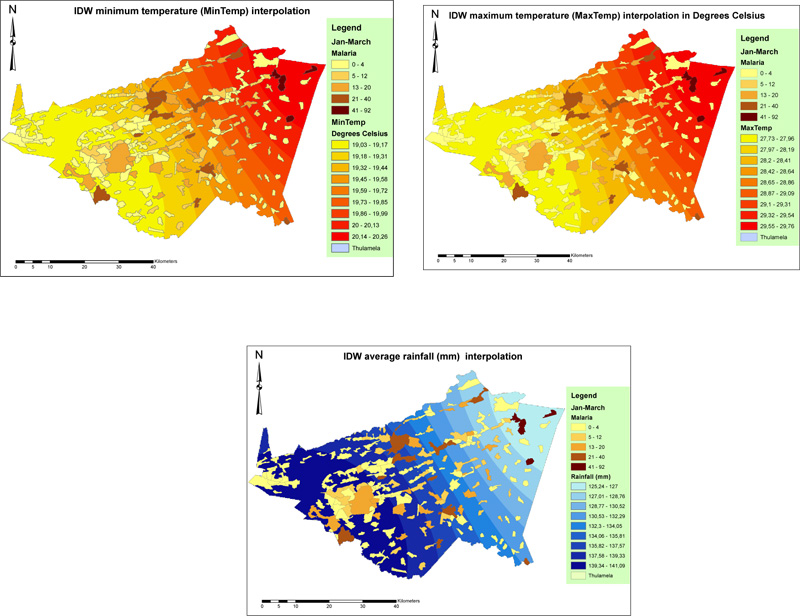
Fig. (6)
Malaria case distribution and local climate factors analysis maps for January to March 2017: Minimum temperature (Top Left), Maximum temperature (Top Right) and Rainfall (Bottom Left).