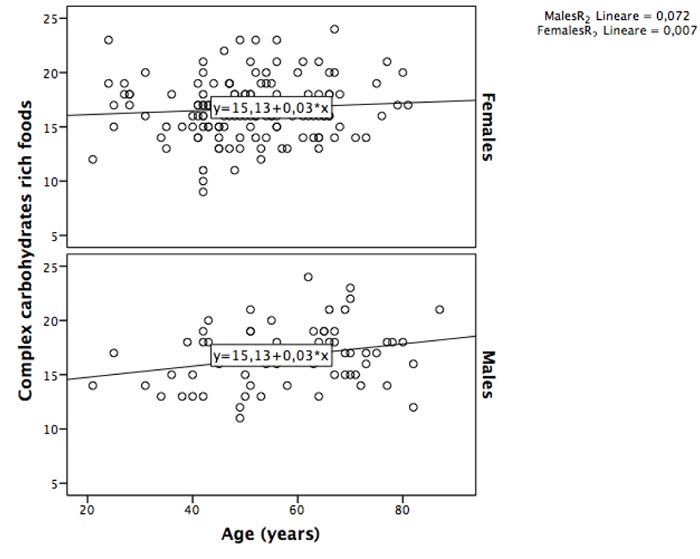
Fig. (2)
Scatter plot of change in age and in complex carbohydrates rich foods, by sex.