Fig. (1)
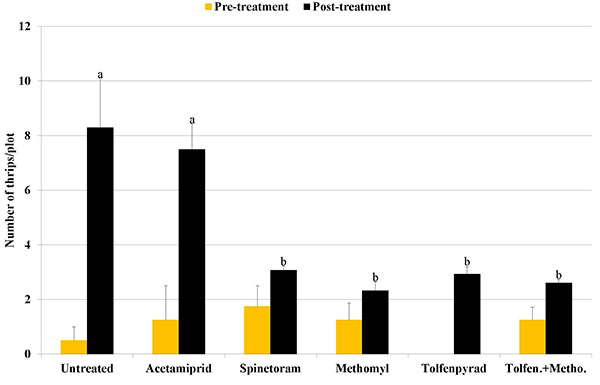
Number of
F. occidentalis
per plot before and after (average of seven sampling dates) treatment in 2011. Bars with no or same letters are not significantly different using Tukey’s HSD (
P
≥ 0.05).