Fig. (2)
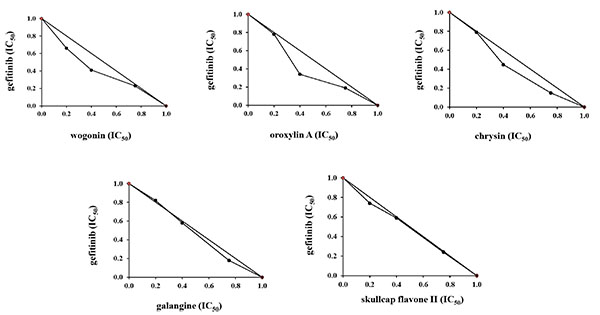
IC50 isobolograms of gefitinib and Wogon flavonoid against A549 cells. The IC50 value of gefitinib alone is expressed as 1.0 on the Y-axis of the isobologram, while that of Wogon flavonoid (wogonin, oroxylin A, galangin, chrysin or sculcap flavone II) alone is expressed as 1.0 on the X-axis.

