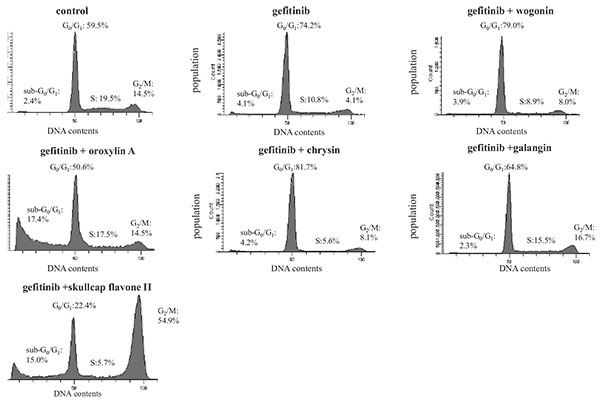
Fig. (3)
Cell cycle analyses of A549 cells. Cells were treated with 0.1% DMSO (control), gefitinib (5 μM) or paired combinations of gefitinib (5 μM) and Wogon flavonoids (each 50 μM) for 24 h. The percentages in the graphs represent the rates of cells of each phase to the total cells.