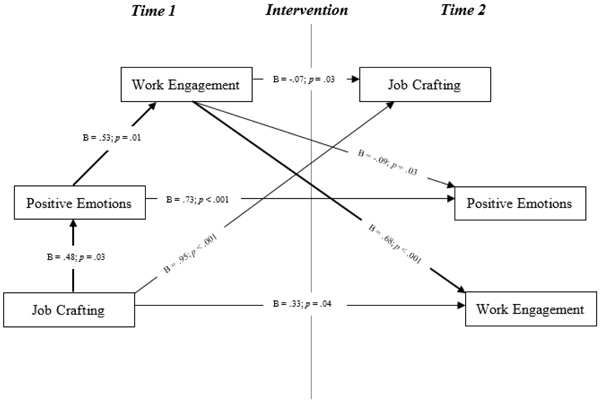
Fig. (1)
Graphical representation of the significant relationships found.