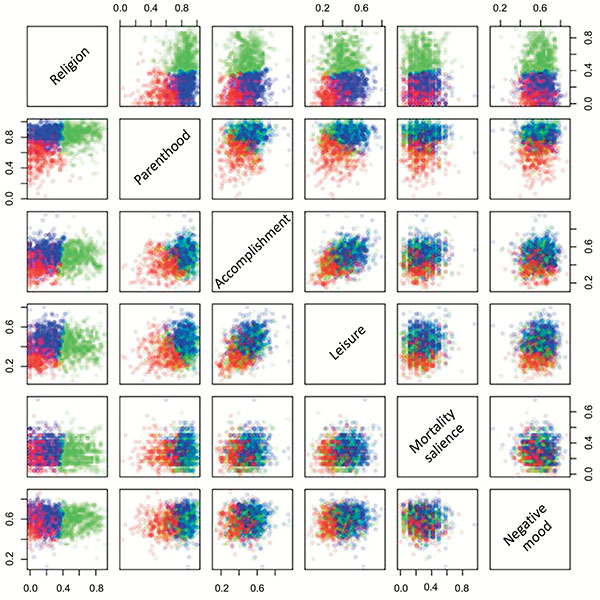
Fig. (5) Pairwise plots of the six indices coloured according to each individual’s type, distinguished by Multi-Dimensional Scaling analysis: (1 – red) low religion / low parenthood scores; (2 – green) high religion / high parenthood scores; and (3 – blue) low religion / high parenthood scores. Note that data points are defined with transparency so that the degree of overlap among points can be easily deciphered; i.e. greater overlap (concentration of data points) is indicated by more intense colour.