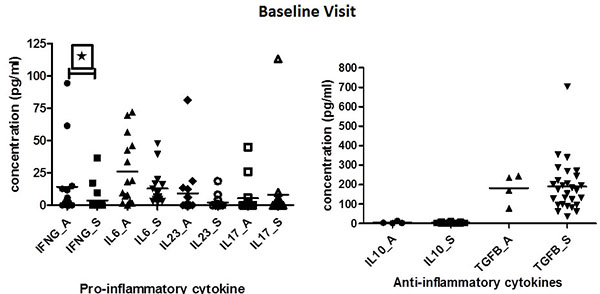
Fig. (1)
Represents the concentration of concentration of pro and anti-inflammatory cytokines in serum sample of TA patients (active (A) and stable (S)) at baseline (BL).