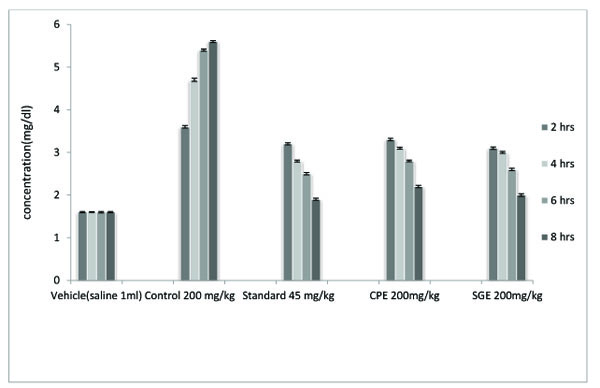
Fig. (6)
Decrease in uric acid concentration in treated and untreated rats. Values are Mean± SEM value, n= 6 animals in each group. Error bars indicate the LSD (least significant difference (P <0.001) calculated using one-way analysis of variance ANOVA) followed by Bonferroni t-test. CPE and SGE were not significant after 4 hrs.