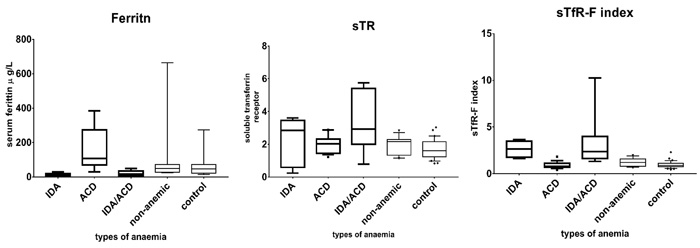
Fig. (2)
BOX and Whisker plot showing the median and the interquartile range for Serum Ferritin, sTR, sTfR-F index values across different anaemia categories and the control group.