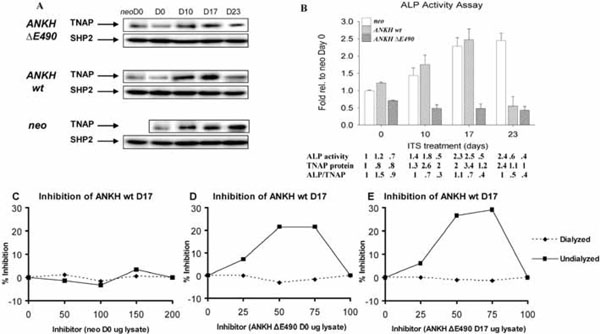
Fig. (4) Alkaline phosphatase (ALP) activity in various transfectants. (A) Western blots showing TNAP protein expression. Quantification of relative TNAP expression was normalized with SHP-2 expression (also used as a specificity control). (B) Relative ALP activity of various transfectants at different time points (D0, D10, D17, and D23) of ITS treatment expressed as fold relative to that of neo-controls at D0. There is a statistical significant difference (Two-Way Analysis of Variance p-value <0.001) among the various transfectants and the neo-controls at each time point. Arrow bars denote SD (n=4). Relative ALP activity, TNAP protein levels (estimated by Western blot analysis and normal-ized with the expression of SHP-2), and ALP/TNAP ratio were tabulated. (C,D,E) Mixing experiments showing the presence of inhibitors in the lysates from ANKH ∆E490-transfectants. Lysates from ANKH wt- D17 ITS and neo- D0 (C), ANKH wt- D17 ITS and ANKH ∆E490- D0 ITS (D), and ANKH wt- D17 ITS and ANKH ∆E490- D17 ITS (E) were mixed in different ratios and assayed for ALP activity in the mixtures which had 1µ g of protein in all cases. The ALP activity from 1μg of individual transfectant lysate was also measured, and from this, the expected ALP activities in the different mixtures were estimated. Percentage (%) inhibition of each mixture was plotted against different amount of inhibitors (arbitrary numbers from 0 to 200). Solid lines showed % inhibition of undialyzed lysate mixtures and dotted lines showed % inhibition of dialyzed lysate mixtures.