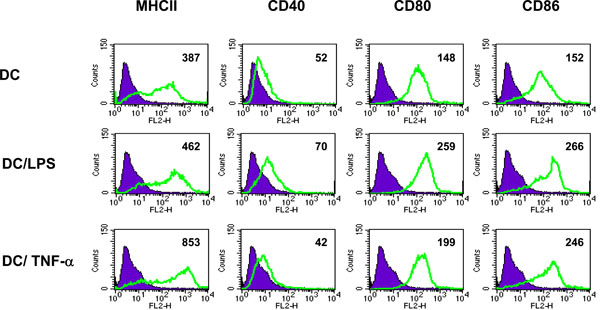
Fig. (1) Phenotype of TNF-α treated DC. DC were unstimulated, activated with LPS (1µg/ml for 4h) or treated with TNF-α (500U/ml for 4h) and analyzed by flow cytometry for cell surface expression of MHC class II, CD40, CD80 and CD86. Filled histograms represent isotype matched control antibody staining. Numbers indicate MFI of stained cells. Data shown is representative of 2 separate experiments.