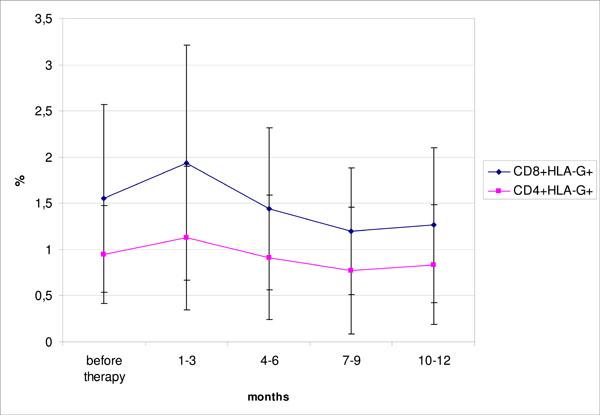
Fig. (2)
Mean frequencies of CD4+HLA-G+ and CD8+HLA-G+ as percentages of CD4+ or CD8+ respectively at different time points during the first year follow up after initiation of rituximab treatment. (mean ± SEM, n=7).