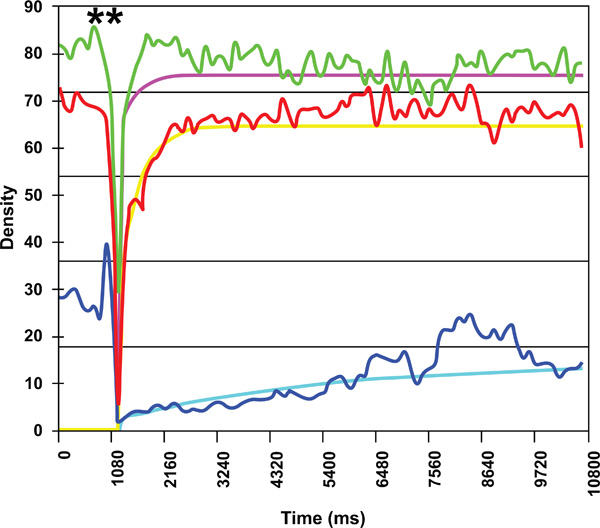
Fig. (2) Example of characterization of renal perfusion in different
regions of interest. Destruction of microbubbles (**). Maximum
enhancement (plateau) in renal parenchyma (red line, line of best fit
yellow) is close to maximum enhancement in the interlobular artery
(green line, line of best fit pink). Blue line (line of best fit blue):
renal pyramids.