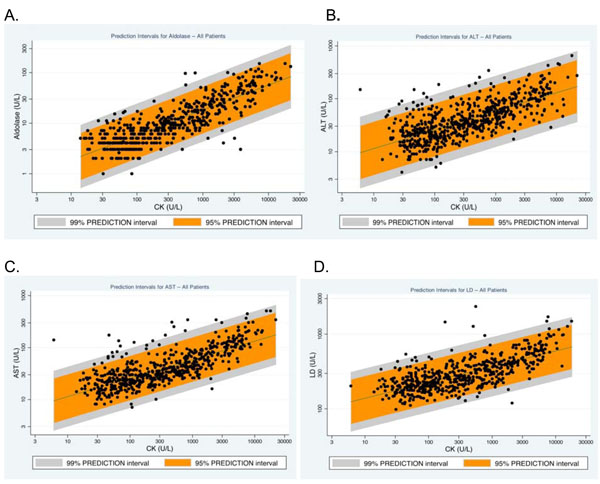
Fig. (4)
Scatterplots and the 99% and 95% prediction intervals for the relationships among CK and aldolase (
A
), ALT (
B
), AST (
C
) and LD (
D
) levels*.*Abbreviations as in Table
1
and Figs. (
1
-
3
).