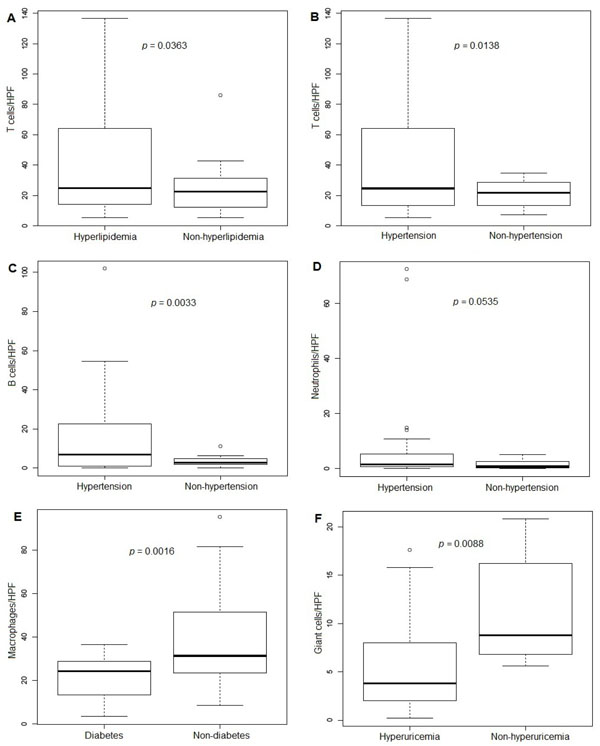
Fig. (3) Association between inflammatory cells, uric acid levels and comorbidities. (A) T cells and hyperlipidemia; (B) T cells and hypertension; (C) B cells and hypertension; (D) Neutrophils and hypertension; (E) Macrophages and diabetes; (F) Giant cells and hyperuricemia. *The line inside the box indicates median value, the box shows 25th and 75th percentiles, the bars indicate 10th and 90th percentiles, and the circles stand for outliers.